Split Testing 101: Best Practices for Your A/B Tests
When you are designing a new website, or even just unveiling a new page, how do you know what your audience will respond best to? How do you know what layout, color scheme, or call to action will convert best?
The answer: you don’t.
At least, not until you test it. You may have a hunch, but you won’t know how it will play out until it is out there in the world.
The process of using user testing and analysis to increase your conversions is called conversion rate optimization (CRO).
Split testing or A/B testing is a big part of that. At the most basic level, split testing simply involves publishing two versions of a page, then splitting your audience evenly between the two versions. You collect data based on those visits and analyze them to determine which version had a better conversion rate – or, rather, which version was more successful at driving signups and sales.
There is a vast array of tools to accomplish this task, both free and paid. Fortunately, if you just need a simple, reliable tool without a lot of bells and whistles, it exists for free and is part of a tool you may already be using: Content Experiments is built into Google Analytics.
What Should You Split Test?
Essentially, you can split test almost anything on your website, but some elements of your website have a much bigger impact than others. Here are some of the most common things to split test, and why they make good candidates for experimentation.
Call to Action (CTA)
Your CTA is the copy that drives a visitor to do something on your website. Whether that something is to sign up for a newsletter, get started with your service, or make a purchase, usually the CTA consists of a few lines of text and a button.
CTAs are one of the most obvious places to perform an A/B test because they can have such powerful results. The CTA is likely driving a good portion of your conversions, so if you suspect that making a few changes will help it drive even more, why wouldn’t you?
When you split test a CTA, you can test its size, placement, color, or the actual copy of the CTA.
Headline
The quality of your headline makes a huge difference in the number of people who will actually read your piece. Consider that 80% of people will read a headline, but only 20% will go on to read the rest of the associated article. Your headline text also has obvious implications for how well it will succeed on social media.
All the way back in 2009, The Huffington post was split testing their headlines: they would randomly show a small selection of headlines to different readers in the first five minutes a story was live (long enough for a site that sees so much traffic to come to a conclusion) and then the best-performing one was set in stone.
Upworthy uses the same tactic to produce its infamous click-bait headlines, seen and shared by millions of Facebook users.
A headline is the eye-catching gateway through which many users discover your content, and you don’t have to be a huge publication to reap the rewards of split testing. You can test as many headlines as you’d like, though two or three is typical.
Hero Image
The “hero image” or “hero area” is the large central image that greets homepage visitors in many modern website designs.
Typically, the hero area takes up all or most of the “above the fold” area of the homepage, and consists of a single powerful image, often with text overlaid.
Obviously, the hero image is prime real estate, so it makes sense to toy around with it and try to make it the best it can be. You can test the image, color scheme, contrast with the CTA or surrounding content, and more.
Layout
This is kind of a catch-all, but playing with the arrangement of the elements on your page can have a big impact.
For example, many landing pages are rather long, and include a lot of details and information about the product or service in question before you ever reach the CTA button or signup form.
Something as simple as putting the signup above the main body of the page (or including a second signup form here) can make a big difference in how users interact with your page.
Sales Page Elements
If your visitors make it as far as your sales page, you want to make sure things are set up for a great conversion rate.
You can split test the size and placement of your products price; the way you display related products (and which products are displayed), the product description, and more.
Marketing Graphics
A/B testing isn’t just for on your website. You can split test different display ads, Facebook ads, and other kinds of digital marketing materials.
Many advertisers make this process exceedingly simple. Facebook, for example, allows you to upload up to six images to split test for one audience when you create an ad through the Ad Manager.
Split Testing Best Practices
Now that we’ve discussed what you can split test, let’s fill in some of the how.
Start with a hypothesis. Split testing is great, but you shouldn’t just rush in without a plan. Changing up random things for the sake of trying something new can sometimes give good results, but usually the results will just be… well, random.
Test radical changes. Along those same lines, make sure the changes you are testing are significant enough to matter. Increasing the size of a CTA button by 5% is unlikely to have as much of an impact as increasing it by 50%.
Give your test enough time. The Huffington Post can split test their headlines for five minutes and declare a winner, but that doesn’t mean you can. Neil Patel recommends running a test for at least two weeks and until you have at least 100 conversions on all variations. Then again, run it too long and you risk missing out on conversions by not displaying the winning variation to all visitors.
Use a calculator like this one to predict how long you can expect to run your A/B tests.
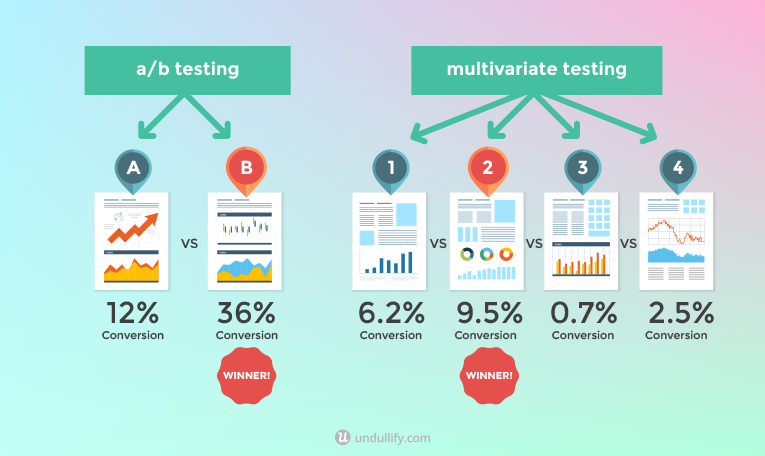
Run the right kind of test. A/B tests at their simplest pit just two options against one another, sending 50% of your traffic to each.
Multivariate testing involves testing a number of different variables at one time, which can result in many options that greatly fragment your audience.
Use A/B testing if you do not get very much traffic or have a very low conversion rate. Use multivariate testing if you get a decent amount of traffic and have several different variables you want to test at one time.
Test regularly. There is a saying in the CRO world (based off the book of the same name): “Always be testing.”
Test whenever you have a new hypothesis. Test whenever you notice new trends in your industry. Test whenever you notice your competitors making new changes. Test whenever you release new products. You can only benefit from continuing to experiment.
How to Get Started Split Testing
Okay, okay, you get it – you want to get testing! So where do you start?
You will need to start with a website that is set up with Google Analytics. You should have the tracking code in place on every page of your website, and also have at least one “goal” set up, such as a newsletter signup or lead form submission. Click here to read a Kissmetrics guide to setting up goals on your website.
Before you set up a test, you need to start with a hypothesis. What could you change about your website that might boost your conversions? Maybe you’ve had a hunch about your CTA for a while, or one of the other ideas above got gears turning in your head.
Hypothesis in mind, you’ll need to create an alternate version of your page that reflects your idea. If you’re altering your CTA, this is as simple as saving a copy of the page and changing the text or styling of that section.
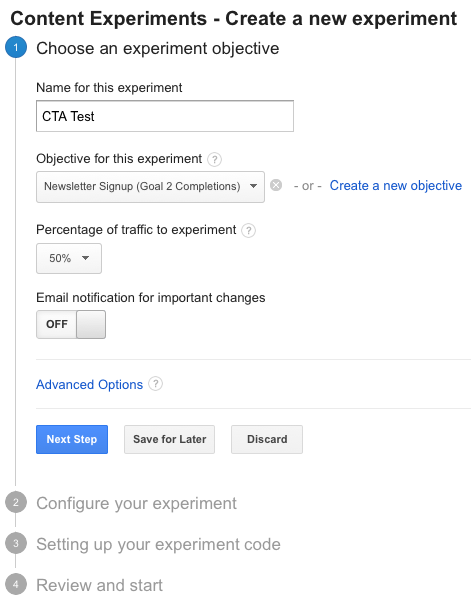
Next, head to the Content Experiments section of Google Analytics, which can be found under Reporting > Behavior > Experiments. Click “Create experiment.”
Fill out the information on the first screen. If you are doing a simple A/B test with just two variations (your original page and your hypothesis page), you will want to send 50% of the traffic to each of them.
If you add additional variations, you will want to decide how to break up your traffic. For example, if you don’t get much traffic but still want to test more than one variation, you may want to send over 50% of your traffic to the “experiment,” or the other variations of the original page.
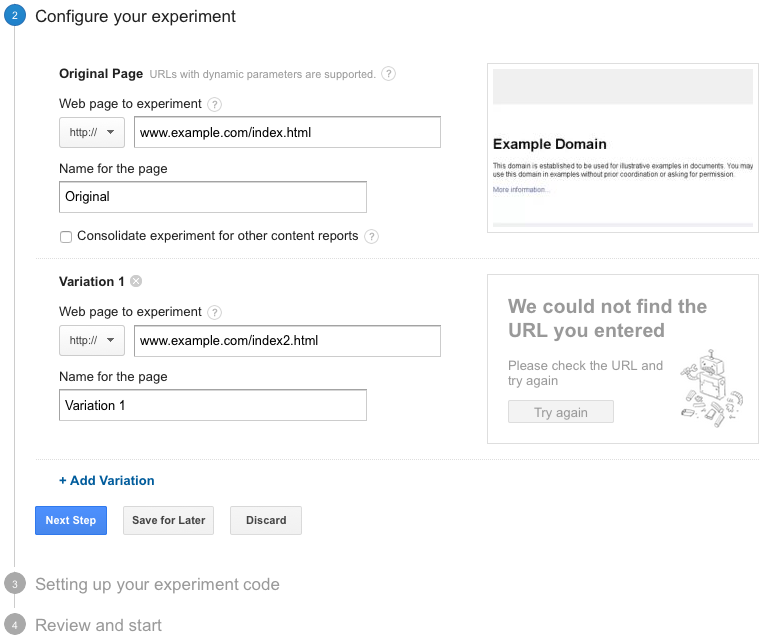
On the second screen, you will actually set up the experiment, telling Google Analytics where your original and experimental pages are located on your website. This is where you can add additional variations.
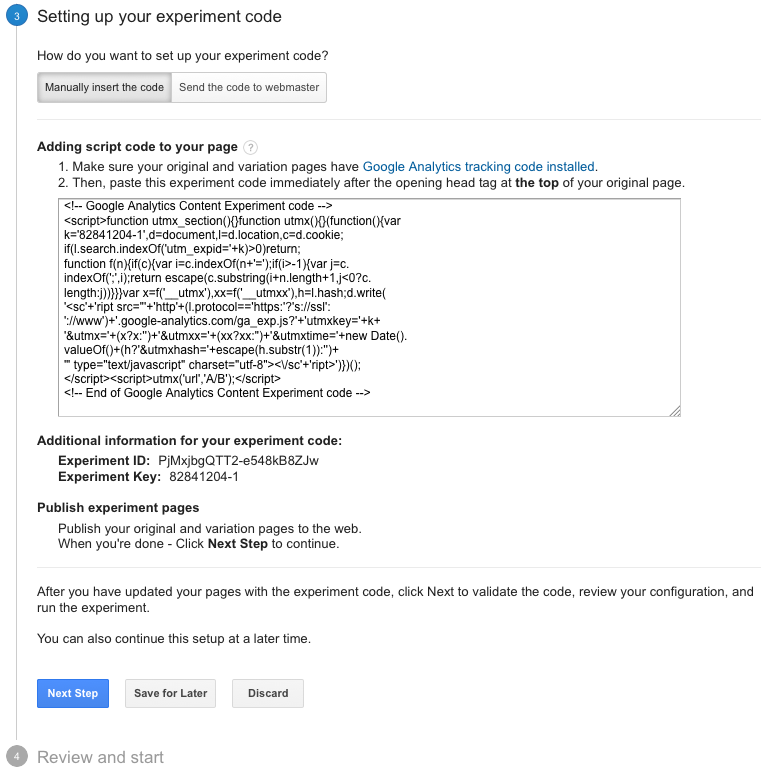
On the next screen, you will have the option to manually add the code to your site or to send it to your webmaster. Click “Manually insert the code” and a box will appear with a snippet of code. Add this code to your original page only, right after the opening <head> tag at the top of the page. This code will take care of redirecting a randomly selected portion of your audience to the experiment.
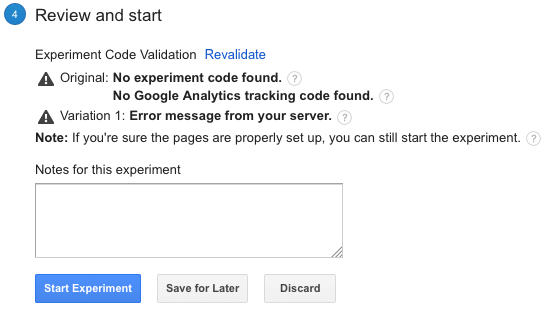
On the final screen, Google Analytics will ensure that your original page has both Google Analytics tracking code and the experiment code, and that all your variations have Google Analytics tracking code. If the code is not found, you may need to adjust your pages and click “Revalidate.” (Yours will most likely look more promising than my example image.)
After that, click “Start Experiment” and Google Analytics will begin running the test. Congratulations – your first A/B test is in the works!
You’ll start to see data from your experiment within a day or two of launching the test. After at least two weeks have passed, Google will declare a winner based on the confidence threshold defined in the “advanced options” on the first screen, by default 95%. That means Google is 95% certain that the winner it declares is the better of the two options.
As you can see, setting up and running an experiment with Google Analytics is extremely easy, so there’s no reason not to start testing your hypotheses and improving your conversion rate!