The Art of Content Recycling: How to Reuse Your Infographic
A lot goes into creating an infographic. From concept to research to design, it can feel like a little bit of a let-down to publish your infographic and just stop there.
Of course, some infographics are viral success stories, and that is okay – because it will live on across other iterations on the web.
But what if nobody bites? Did you just put all that time and money into your infographic for nothing?
You saw the name of the post – I’m not going to let you give up there! “Content recycling” is a content marketing strategy that breathes new life into stuff you might have previously believed to be done and dusted.
You can recycle anything from infographics to white papers by reimagining them in new forms. These new content pieces can capture the attention of brand new audiences, because we don’t all consume things the same way, and different formats are better suited for different distribution channels.
Plus, reimagining your content in new ways is a great way to cut down on the time you spend crafting new content.
Infographics are no exception. You’ve got a great piece of content already – the topic is intriguing, the research is airtight, and the design is brilliant.
Keep reading to learn five new ways to reuse your infographic in new ways.
Infographic to Blog Post
You probably already included an introduction to your infographic when you originally published it, but how in-depth was that blog post, really?
One of the most basic ways to recycle an infographic is to break it down and really explore it in-depth in a detailed blog post. Simply chop up the infographic into its main sections, and expand on them with a few paragraphs of explanation. This is a great opportunity to link back to your source material and really lay the data out clearly for your readers.
This strategy works great because it is a perfect balance of understanding the information presented using visual information and textual information. Your readers can get the gist of what you are saying by looking at the visualizations, and then to really understand it they can dig into the “meat” of the discussion – the blog post.
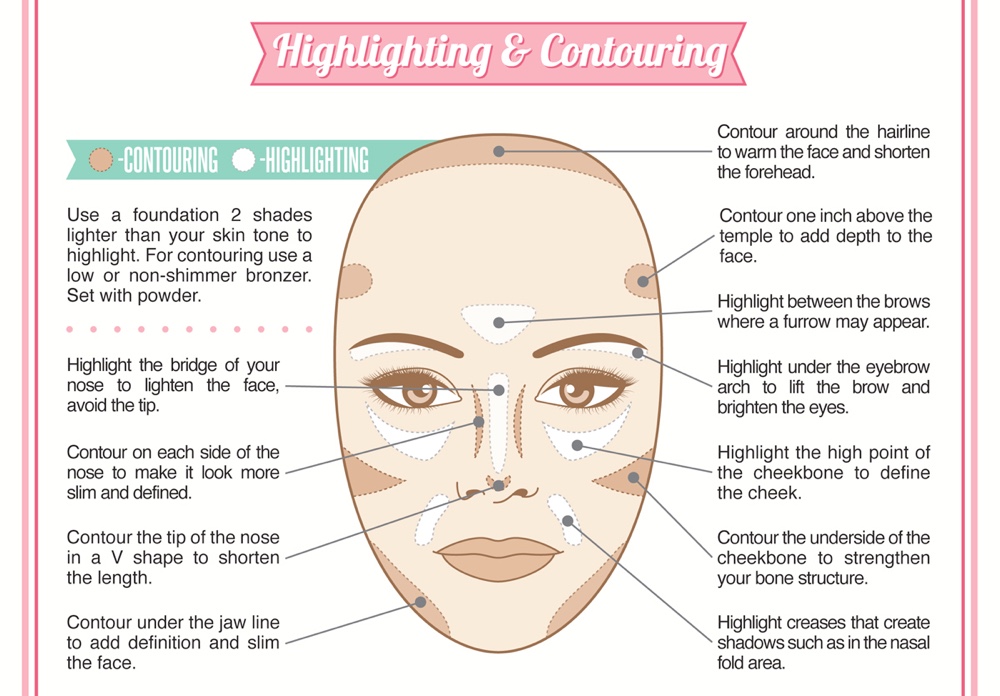
“How to” infographics are perfect for this kind of recycling. You can post the full infographic on its own with a brief description, and then a few weeks or months down the line repost it in sections or even individual posts. This infographic details step by step instructions for applying different kinds of makeup. While the graphic itself is already pretty text-heavy, I could see it being posted sliced up, with videos showing the technique in action.
Infographic to Social Media
This may seem counter-intuitive to some or just plain obvious to others. After all, you can always post a link to your infographic on social media, or share the full graphic itself on a site like Pinterest. In fact, Pinterest is a great place to share infographics, precisely because the long, skinny format gives your graphic a lot of screen real estate.
However, that same long format isn’t conducive to every social network; in fact, on most, it would either appear cut off or very small. This is where it is again helpful to break your infographic down into bite-sized chunks; in fact, depending on how well they stand alone, you might even be able to reuse cut up parts you created for a blog post.
The other benefit? Breaking up the graphic this way can turn a single piece of content into a series that your followers come back for over and over! All for the time it takes to slice it down.
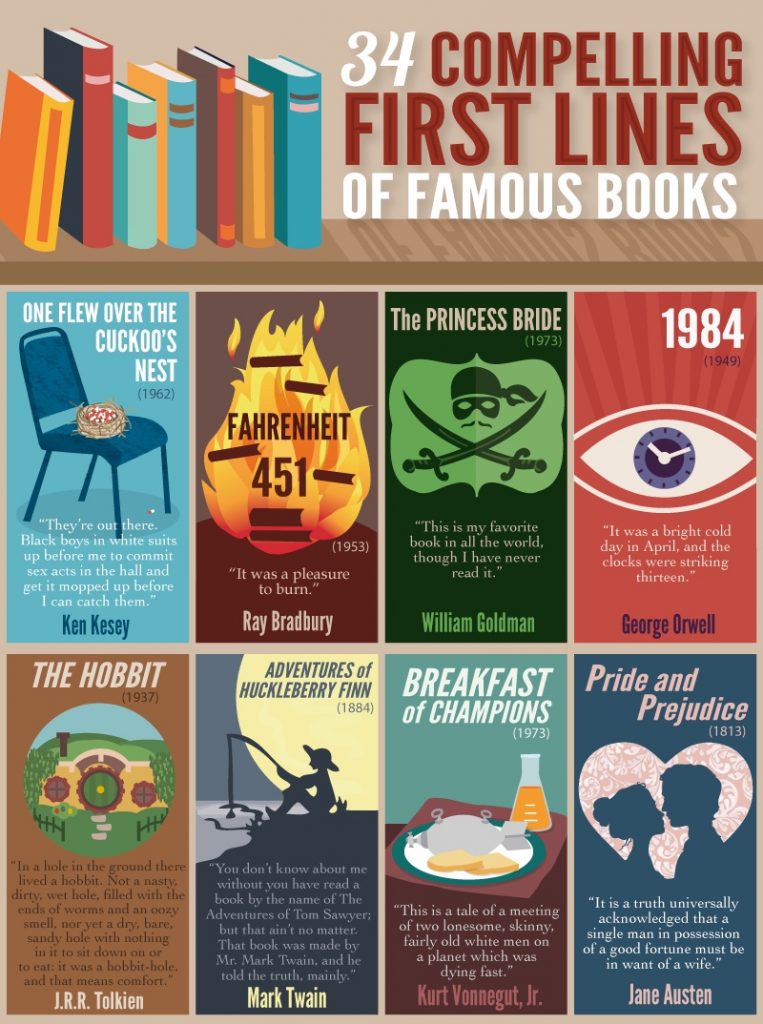
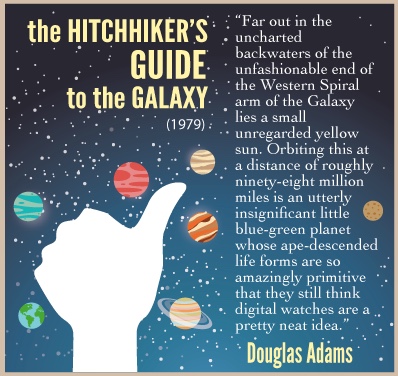
This infographic featuring 34 famous first lines to classic novels is compelling enough on its own, but each quotation could make a great Instagram post (many, like the examples below are already in a square format!) or over a month’s worth of daily Facebook updates!

Infographic to Newsletter
It is easy to neglect creating actual content for your newsletter and instead making it read like a list of links to your most recent blog post. Why not give your newsletter a little TLC and craft some content to draw people in right from their inbox?
Even if you just share an excerpt of your infographic in your email and direct readers to your website to see the rest (after all, infographics are notoriously large in file size), it can breathe new life into your newsletter.
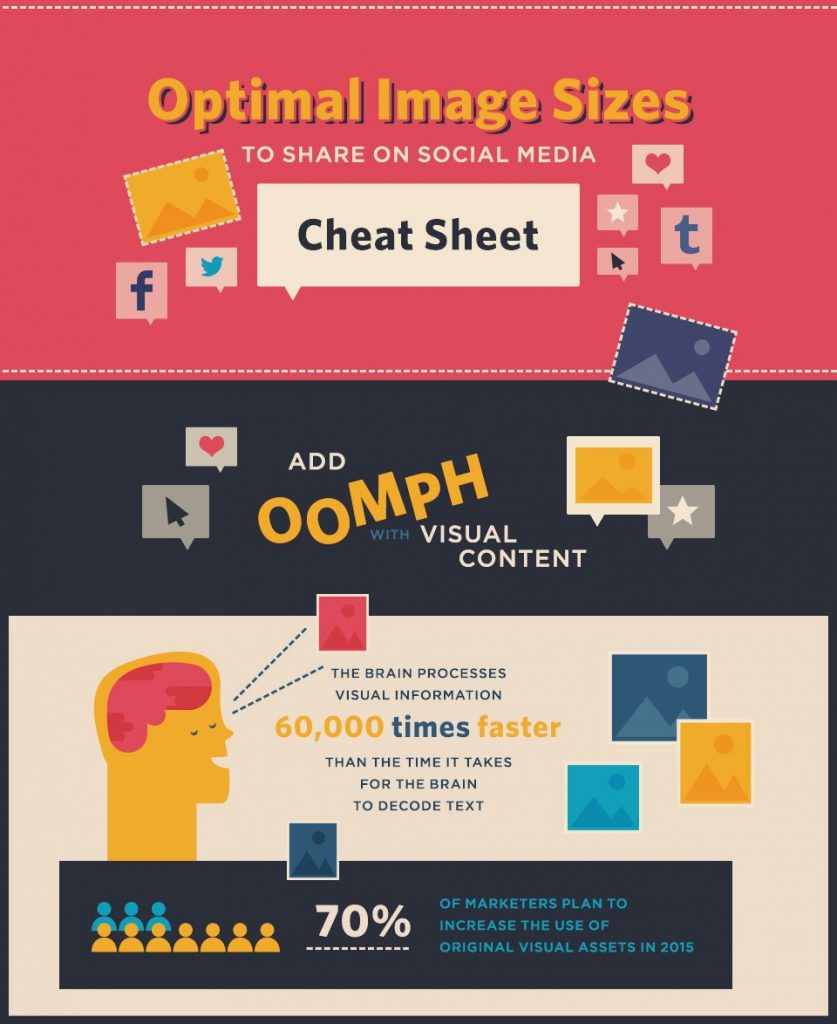
Social media image size charts like this one are a pretty common offering on marketing blogs, but they’re also incredibly useful. Most people aren’t loyal to just one – they just use the first one they come across. The first part of the graphic would make a great teaser in their newsletter to get their readers clicking through to use or bookmark the infographic.
Infographic to SlideShare
SlideShare is a popular slideshow and PowerPoint sharing website. Since it is such an established platform, it can be a great place to post recycled content because it is often fairly easy to get a SlideShare presentation to rank well. Then, you can refer those visitors to your main website.
If you can slice your infographic down to slide size (1024 x 768 pixels), it is really easy to turn it into a slideshow. Just create a presentation with those images set as full-screen backgrounds and upload to SlideShare.
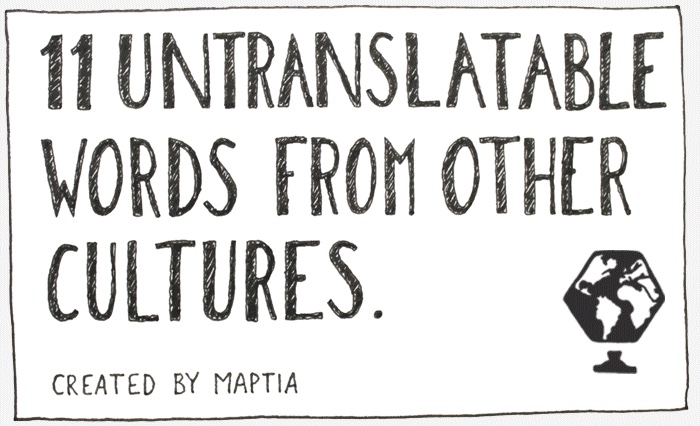
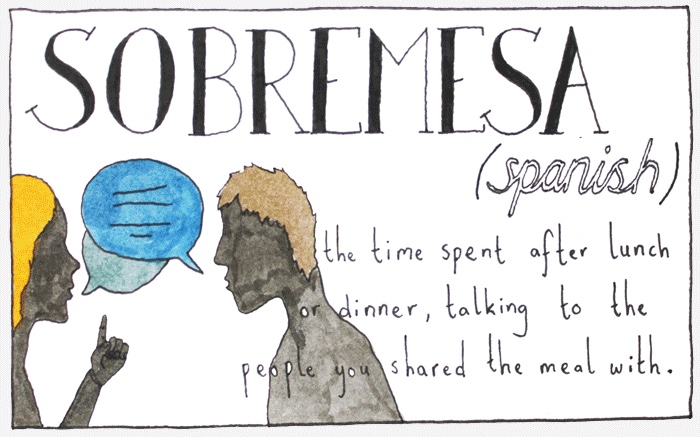
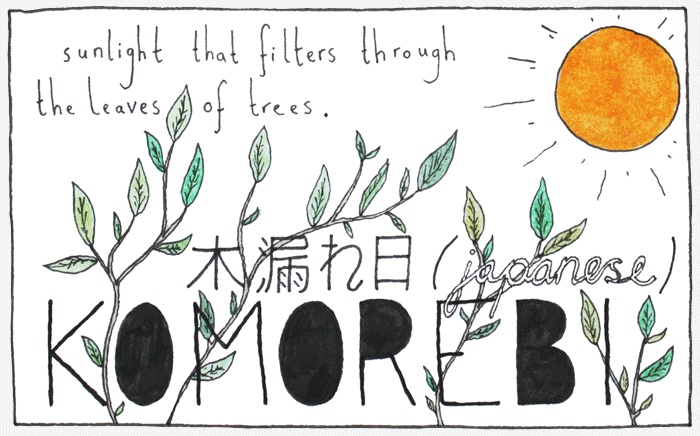
This infographic of 11 untranslatable words from other languages by Maptia was, for a very long time, the number one rated infographic on Visual.ly. It is already presented in equally sized sections that could easily be turned into a slideshow.
Infographic to Video
One final way to breathe new life into an infographic is to animate it!
Depending on how you set up your original infographic file, it may be relatively easy to turn it into a simple video. However, if you know ahead of time that you will want to turn the infographic into a video down the line, make sure you tell your designer, as it may impact the way they set up their design.
The resulting video can be posted on your blog and YouTube, but it can especially make an impact on social media. You can share the video on Facebook or Twitter, where it will autoplay on users’ feeds, or in short snippets to Instagram.
Many infographic videos, or “motion graphics,” are created from illustrations or vector graphics, but they don’t have to be. This infographic, which overlays photographs of famous child actors with their look in later years, still translated pretty well to the video format, opening doors to a new audience of YouTube viewers.
Wrapping Up
Different people prefer to consume content online in different ways. The greater the variety of ways you can serve up your infographic, the more people you are likely to reach.
How do you recycle your infographics? Do you use any of the strategies listed above, or do you promote them in another way? I would love to hear your experiences in the comments below!